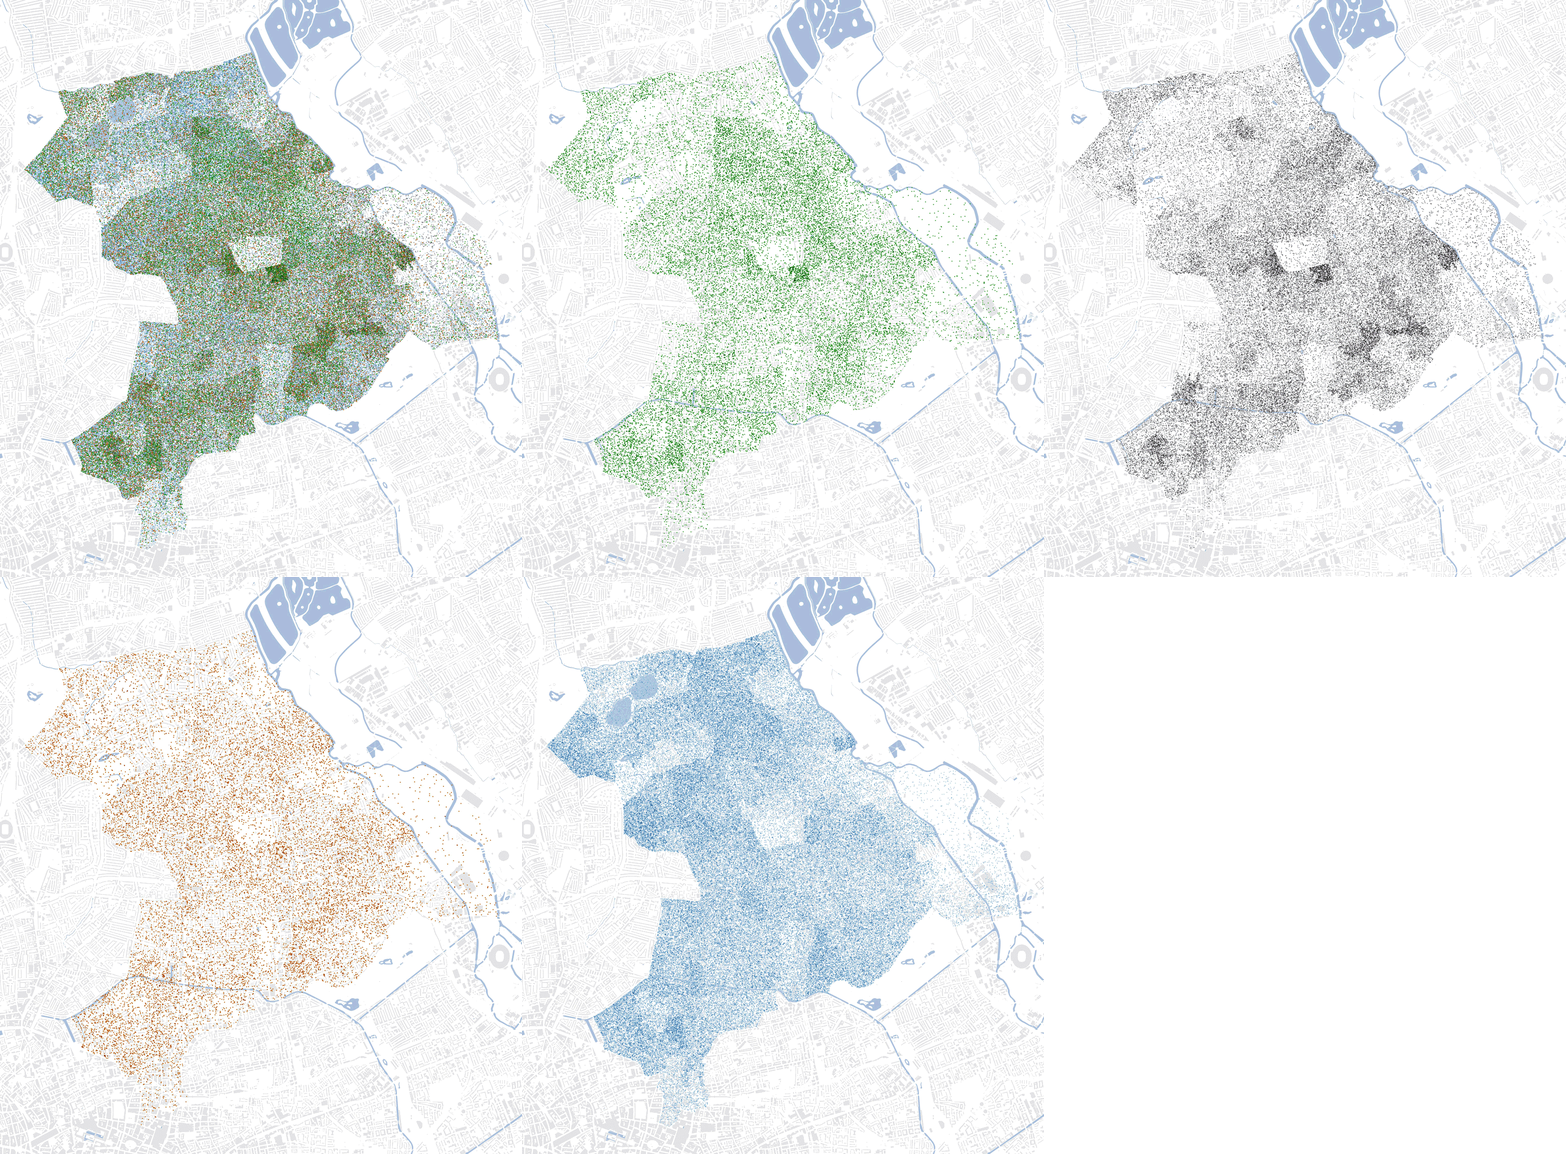
Hackney Ethnic Diversity

A 'pointillism' map illustrating the ethnic diversity across the London Borough of Hackney. Each dot represents approximately five people and are generated by census data by Statistical Area. Green dots are those reporting as Asian / Asian British; grey dots, Black / African / Caribbean / Black British; orange dots, mixed or multiple ethnicity; and blue, White / White British.